In the
field of QSAR research, a polynomial expansion of the inner relationship, which
is linear in the original PLS, has become popular to model nonlinear relationships
[38],[228][240]-[247]. If the polynomial terms are of the second
order, this approach is also known as QPLS (quadratic PLS). Instead of the linear
relationship between the score matrixes U
and T, following polynomial expression is used:
(30)
The coefficients
C0, C1 and C2 are determined by the least
squares method in an iterative procedure similar to the PLS. For the calibration
data, QPLS models were built with an optimal number of principal components
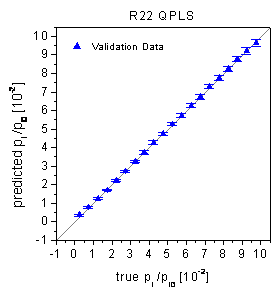
determined by a minimum crossvalidation error of the calibration data. For R22
the optimal model with 2 principal components predicted the calibration data
with a rel. RMSE of 2.31% and the validation data with a rel. RMSE of 2.41%.
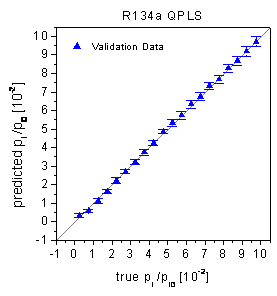
For R134a the optimal model with 4 principal components predicted the calibration
data with a rel. RMSE of 3.87% and the validation data with a rel. RMSE of 3.92%.
The sensibly low number of principal components is "rewarded" by practically
identical validation errors and calibration errors. Both, the Wald-Wolfowitz
Runs test and the Durbin-Watson Statistic cannot find a significant non-randomness
in the prediction of the validation data. In combination with the true-predicted
plots (figure 36) and the low errors of prediction,
it is obvious that among the different PLS approaches the QPLS can deal best
with the nonlinear data set. In the next sections, several non-PLS methods,
which are also know to be able to account for nonlinearities, are applied to
the calibration and validation data set.
figure 36: True-predicted plots
of the QPLS for the validation data.